
About the Research
Here at Mandalay, we have collaborated with Footprints Market Research to undertake online research with over 1,500 Australians. Our goal is to help local councils across gain a better understanding of waste and recycling behaviours. A portion of the data within this report has been interpreted in this blog. For even more insights, download a copy of the full Mandalay 2020 Waste Report.
How much are local council tips being used?
In this blog, we look at how extensively local council tips are being used in communities and whether residents are satisfied with those services. In particular, the data insights cover the frequency of local council tip use, distance travelled to visit a tip and overall resident satisfaction. These data insights may serve as a helpful tool to support decision making around planning and service delivery for communities.
What does the data tell us?
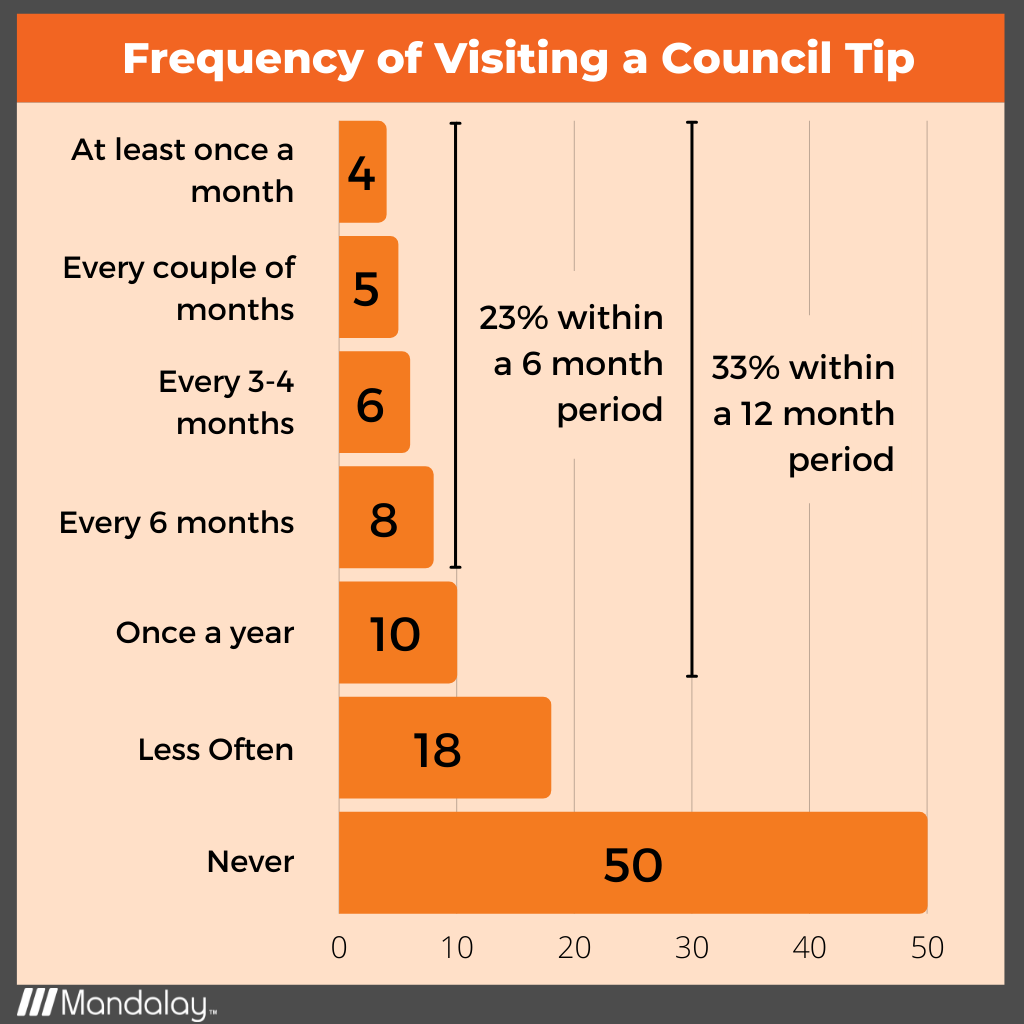
Frequency of Visiting a Local Council Tip
Participants in this survey were asked about how often they visit a local council tip to dispose of household waste or recyclables. Of the participants surveyed:
- 50% of participants reported having never used a local council tip.
- Almost one quarter or 23% of participants reported using the local council tip once or more within a six-month period.
- One-third or 33% of participants reported accessing the local council tip once or more within a 12-month period.
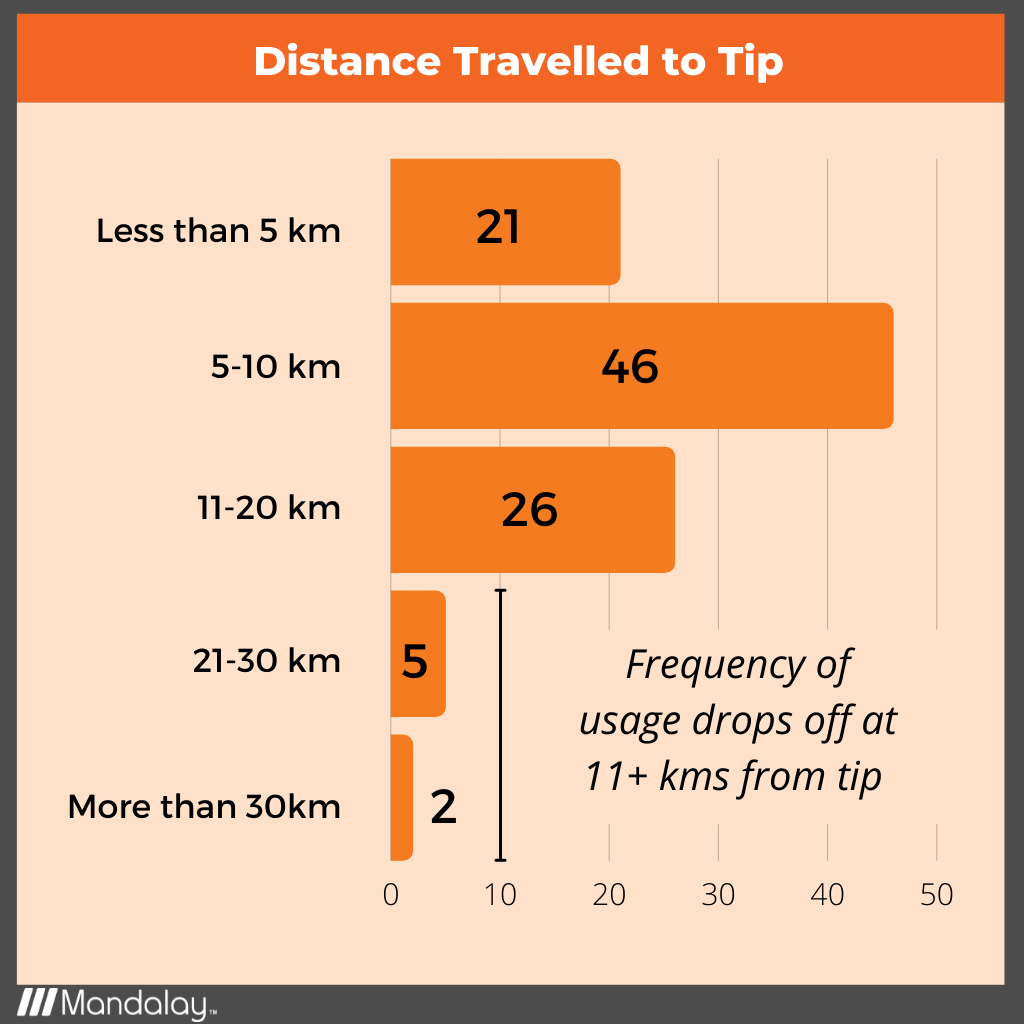
Distance Travelled to Visit a Local Council Tip
Participants were asked about how far they travelled to visit their local council tip. Of the participants surveyed:
- 46% of participants reported travelling between 5kms and10kms to get to the local council tip.
- The frequency of usage drops off for those who had to travel more
- 26% of participants travelled between 11kms and 20kms;
- 5% of participants travelled between 21kms and 30kms; and
- 2% of participants travelled more than 30kms.
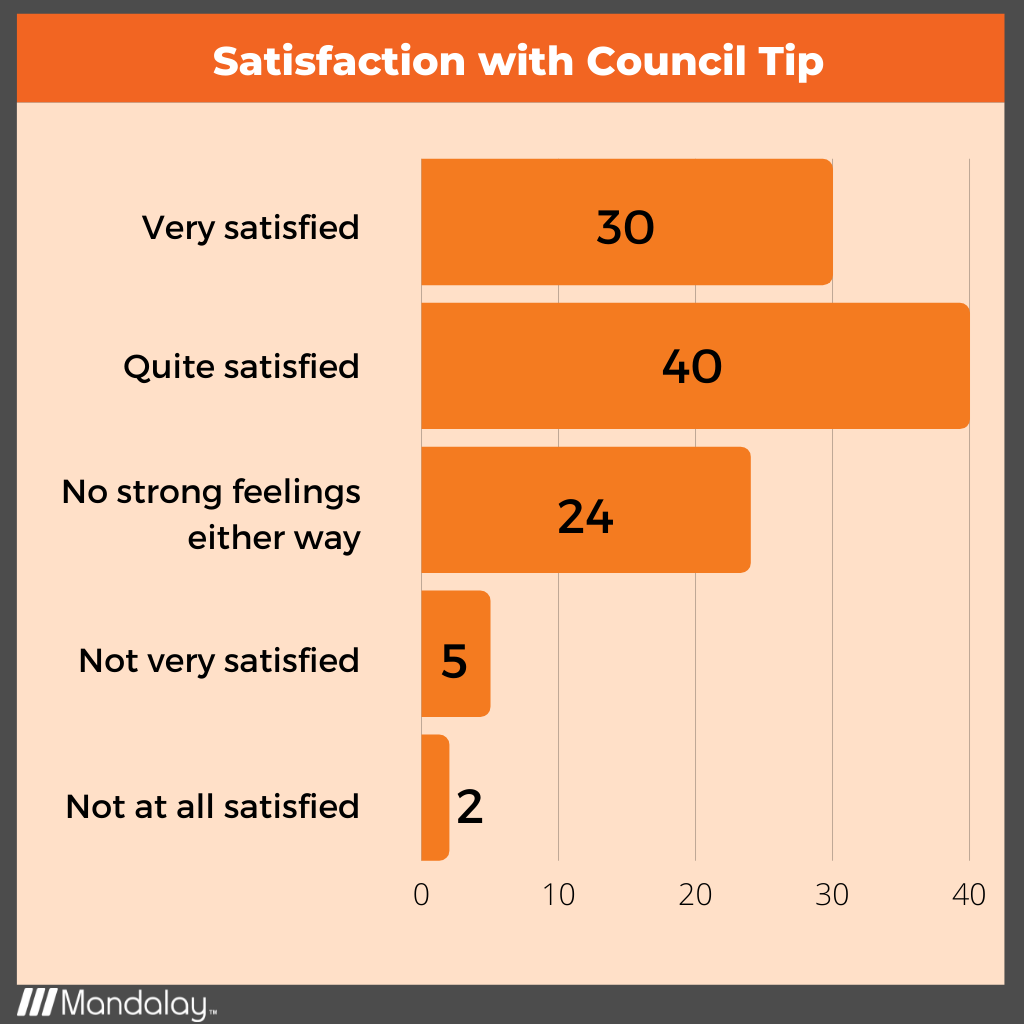
Local Council Tip Satisfaction
Participants were asked how satisfied they were with the local council tip and the data shows that there are good levels of satisfaction with local council tips (70%).
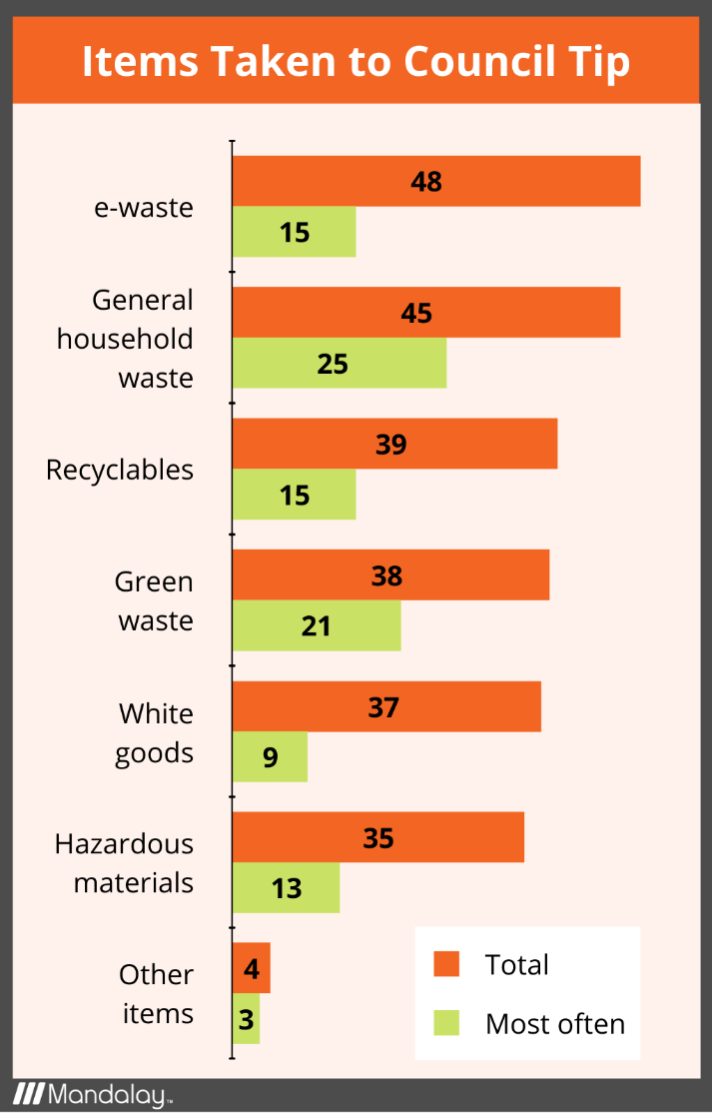
Items Taken to the Council Tip
Participants were asked about the types of items they have taken to the local council tip and which of these items they have taken to the tip most often.
Almost half have taken e-waste to the tip followed closely by general household waste. General waste is dropped off at tips most often, followed by green waste.
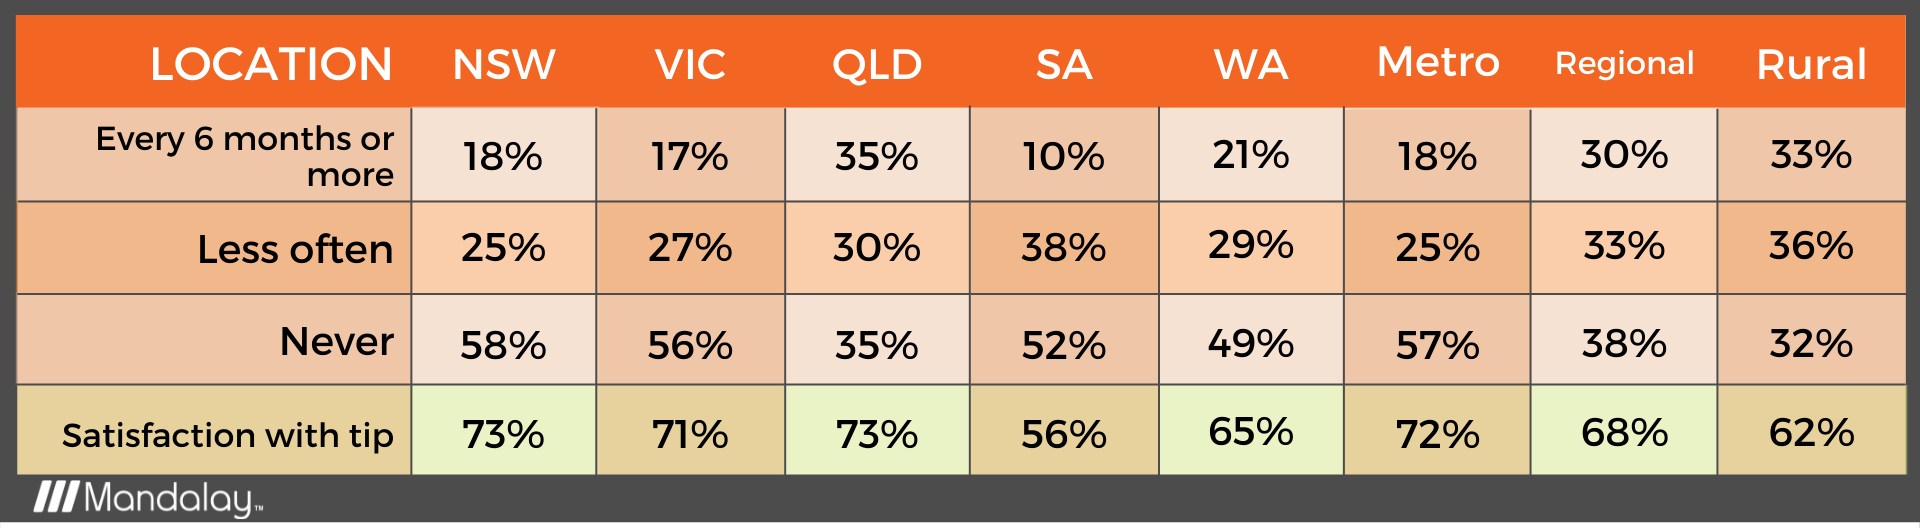
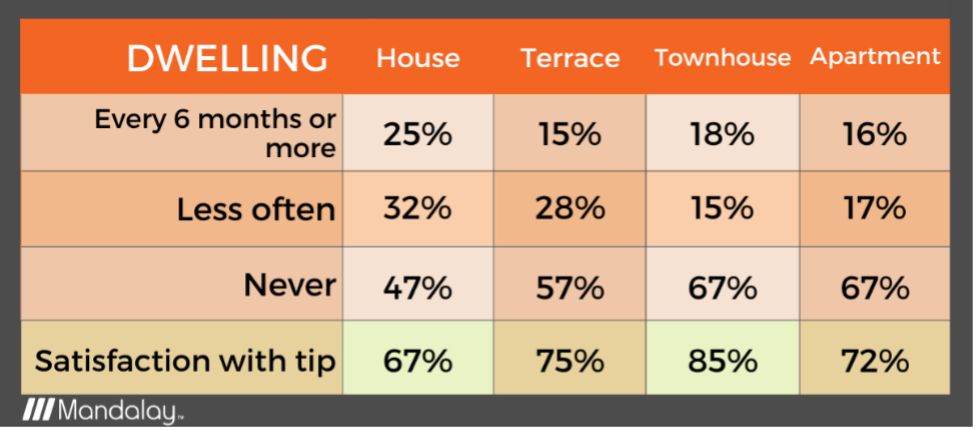
Tip Usage and Satisfaction by Location and Dwelling Type
Local council tip usage is significantly higher in Queensland – where only 35% of Queenslanders reported never using the local council tip, while over 50% reported never using the tip in all other states. Tip usage was also higher in regional and rural areas and for those who live in freestanding homes, while metro regions appear to have much lower usage.
Satisfaction levels for local council tips sit around 70% for all states except for South Australia, which has the lowest satisfaction level of 56%.
What can we learn from the data?
The data suggests there are a large portion of residents across the country that may not be making use of local council tips, with 50% of participants surveyed reporting never having used one. While there are a multitude of factors that could be contributing to the lower usage of local council tips, the tyranny of distance is one that appears to have featured most prominently in our data insights. That is, the longer the distance of travel required to get to the tip, the less likely residents were to use it.
The other interesting point worth noting from our data insights is that individuals who lived in freestanding homes or those who lived in regional and rural areas appear to be more likely to use a local council tip. Conversely, those in metropolitan areas were less likely to use a local council tip and less often if they did utilise that service. There are undoubtedly many factors that could be attributed to these insights – for example, residents with larger properties were likely to generate more waste and thus require the service more often or residents in regional communities did not have the same level of waste pick up services as metropolitan communities.
Regardless, what is most important is to recognise that when it comes to waste infrastructure, developing tailored solutions that meet community needs and derive value for local governments is key. For leaders in local government, one of the most challenging responsibilities is planning, delivering, and maintaining infrastructure. This includes local council tips. Without accurate and relevant waste data, the delivery of these services can and will fall short of community needs.
With accurate and relevant waste data, leaders in local governments would be better equipped to make informed decisions to meet the needs of their communities and ensure their investments are delivering longer term value. The Federal Government recognises the importance of waste data in supporting better decision making and has set a target of making comprehensive, economy-wide and timely data publicly available as part of the 2019 National Waste Policy Action Plan.[1] As part of its work to deliver on this target, the Federal Government is working towards developing a database of national waste infrastructure and an assessment of its adequacy by the end of 2021.[2]
Perhaps even more importantly, what we can also learn from the data is that, in fact, local councils are missing a massive opportunity across their waste facilities – have a think about what other industry has 100% of the population as the market opportunity. That is, every person and every household generate waste material and local council are currently only servicing 50% of the available market when it comes to local council tips. Imagine what other services and offers could be made available to customers or, alternatively, what other waste and recycling services are not being offered because facility operators are not fully understanding customer needs.
Some questions to consider… What are the facility offerings that need to be developed to meet the waste needs of the other 50%? Why think about facilities just as drop off centres only for material? Why not think about what other services and products could be made on offer to customers as part of their drop off requirements? How would a traditional retailer view the customer service experience of a waste facility?
There are clearly many players operating in the space with many opportunities to be harnessed. Future planning for more tailored and complete waste services will require a concerted efforts from all of them – including all levels of government, industry and communities alike. This kind of collaboration will be critical to ensuring that the waste services of the future meet the needs of communities and businesses alike and deliver value for asset owners.
[1] Federal Government (2020). National Waste Policy Action Plan (page 28).
[2] Blue Environment (2020). National Waste Report 2020 (page 9).
Want access to even more statistics and insights on awareness and behaviours towards waste and recycling in Australia?
Download a free copy of Mandalay’s 2020 Waste Report here.

Read Part 3 within the Resident Waste Insights Series – What’s in Our Wheelie Bins?